
How to Read Your Solar Monitoring App and Spot Underperformance Early
A 6.6 kW solar system that's underperforming by 15 per cent costs the average homeowner around $300 a year in lost generation, and most owners never notice. The system still works. The lights still come on. The bill still drops compared with no solar at all. But the system isn't earning its full keep, and the loss compounds over the lifetime of the install.
Every modern inverter comes with a monitoring app. Knowing what to look for is the difference between an early catch and a problem that runs for years.
### What your monitoring app actually shows you
Most residential solar monitoring apps display roughly the same core information:
- Live power output, what the system is producing right now, in kilowatts - Daily energy production, the total kilowatt hours generated each day - Historical data, daily, weekly, monthly, and yearly production charts - Consumption data (if a consumption monitor is fitted), what your home is using - Export data, what's being sent to the grid
The detail level varies by inverter brand. Fronius Solar.web, Sungrow iSolarCloud, and Huawei FusionSolar each offer slightly different views and granularity, but the core metrics are similar.
### The single most useful chart: daily production
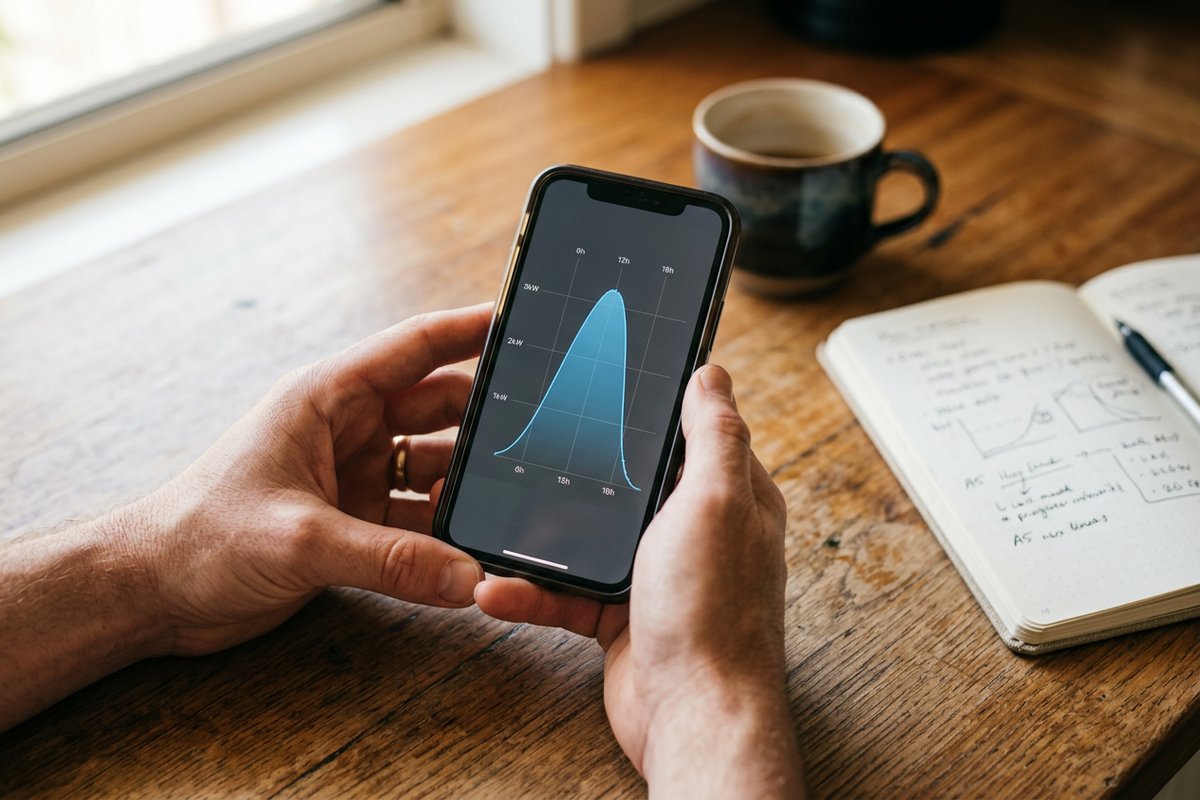
Open your app on a sunny day, scroll to the daily production chart, and look at the curve. A healthy system on a clear day produces a smooth, symmetric curve that rises through the morning, peaks around midday (or slightly after), and tapers through the afternoon. The peak production should be close to the system's rated capacity, a 6.6 kW system on a clear day should hit somewhere between 5.5 and 6.5 kW at peak in summer.
When something's wrong, the shape changes. Common patterns:
- Flat-topped curve, the inverter is "clipping," meaning the panels are producing more DC power than the inverter can convert. This usually means the system is oversized for the inverter, which is normal up to a point but can indicate a design issue if severe. - Dips during the day, sudden drops in the curve on a clear day point to shading from trees, structures, or even bird droppings on specific panels. - Asymmetric curve, if morning production is much higher than afternoon (or vice versa), one section of the array may be underperforming due to shading, orientation issues, or a fault. - Lower-than-expected peak, if the system never approaches its rated capacity on the clearest summer days, something is limiting it.
### Compare days, weeks, and seasons
Single-day data doesn't tell you much in isolation. Compare across:
- Sunny day to sunny day, production should be similar on similar weather days. A clear day in February should outproduce a clear day in June, but two clear summer days should be within 5-10 per cent of each other. - This year vs last year, most apps overlay historical data. Year-on-year comparison on similar months catches gradual degradation that single-day comparisons miss. - Your system vs the manufacturer estimate, when the system was installed, the installer should have provided an expected annual generation figure (in kWh). Compare your actual annual production against that estimate.
### Red flags worth investigating
Some patterns are worth flagging to your installer for inspection:
- Sudden drop in production that doesn't match weather, most often a tripped breaker, fault, or wiring issue - Persistent underperformance of 10 per cent or more compared with previous years - Inverter fault codes, most apps display alerts; don't ignore them - One string producing significantly less than another (on multi-string inverters), usually shading, soiling, or a panel fault on the underperforming string - Production stops entirely during the day, almost always a fault that needs immediate attention
### Soiling, shading, and the things you can fix yourself
Some performance drops have simple causes you can address without calling the installer:
- Visible dirt on panels, bird droppings, pollen, tree sap, and general grime can reduce output by 5-15 per cent on heavily soiled panels. A gentle clean (or rain after a long dry period) restores performance. - New shading from growing trees or new structures, sometimes a tree that didn't shade the array five years ago now shades it for part of the day. Either trim the tree or accept the reduced output. - Bird nesting under panels, pigeons and other birds nest in the gap between panels and roof, and their droppings on panels reduce production. Bird mesh or pest protection (a one-off install) prevents the issue.
### When to call the installer
If you've ruled out weather, soiling, and shading, and the system is still underperforming significantly compared with previous years or its rated estimate, it's worth a service call. A qualified solar technician can:
- Pull detailed performance data from the inverter - Test individual panels for hot spots, microcracks, or degradation - Check for loose connections, water ingress, or rodent damage in cabling - Verify the inverter is operating within its design parameters
Catching a fault early often means a single-panel replacement rather than a system-wide problem.
### Frequently Asked Questions
#### How often should I check my solar monitoring app?
Weekly is sensible. Daily is unnecessary unless you're actively troubleshooting an issue. Set a recurring reminder to compare this month's production to the same month last year, that single comparison catches most gradual degradation.
#### What if I can't access the original monitoring app from the installer?
If you bought the home from someone who had solar installed and the original installer is unreachable, contact the inverter manufacturer directly. Most brands can re-link a system to a new owner's account with proof of address and the inverter serial number.
#### Is panel-level monitoring worth the extra cost?
Panel-level monitoring (via microinverters or DC optimisers) is genuinely useful for systems with partial shading or panels facing different directions. For straightforward unshaded north-facing arrays, string-level monitoring is usually sufficient and saves cost.
#### Does cloudy weather count as underperformance?
No, solar output drops dramatically under cloud cover, and a heavily overcast day might produce 10-30 per cent of a clear day's output. That's normal physics, not a fault. Compare clear days to clear days when assessing performance.
### Concerned Your Solar Isn't Performing in Erina?
Get a free, no-obligation system check from a local SAA accredited solar installer serving the Central Coast.
[Button, Insert Custom Code: "Chat With Our Team", href: https://solarerina.com.au]
Talk to a Local Central Coast Electrician
Get a free, no-obligation quote from a licensed electrician serving the Central Coast.